





 Tools for Jira
 Tools for monday.com




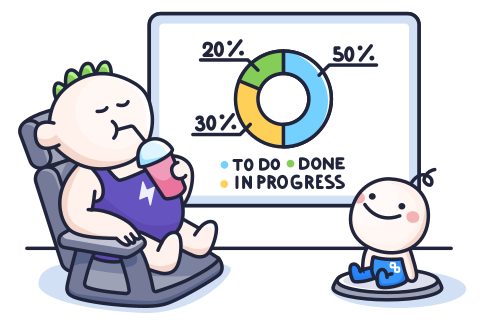
Most teams already have a Jira dashboard. What most teams do not have is a dashboard that answers a specific question. The kind of view that tells a delivery manager whether next Friday’s release is actually ready, not just whether tickets are moving.
That gap is what this guide is about.
Jira dashboards combine gadgets, filters, and JQL queries into one view that pulls data from across projects. Set up well, they replace status meetings. Set up poorly, they become another tab nobody opens.
This article covers how Jira dashboards work, which gadgets fit which team, and how to build one step by step. You will also see how to extend past native limits when you need to track something Jira does not report on out of the box. One common example: whether every checklist item on a release story is actually complete before it ships.
If you lead a team, run projects, or administer Jira, this guide walks through the setup and the design choices that make a dashboard worth reviewing.
Key takeaways
- A Jira dashboard is a customizable page of gadgets that pull live data from one or more projects into a single view.
- Gadgets combine a saved filter or JQL query with a visualization such as a chart, table, list, or progress indicator.
- Native Jira ships with roughly 30 gadgets covering sprints, workload, activity, and filter results, and marketplace apps add specialized ones.
- To track process compliance like Definition of Done or release readiness, Smart Checklist adds dedicated dashboard gadgets for checklist completion, item status, and assigned items.
- Sharing depends on project permissions. If users cannot view the underlying projects, they will see empty gadgets even after the dashboard is shared.
What is a Jira dashboard?
 Definition
A Jira dashboard is a customizable page inside Jira that displays gadgets. Each gadget pulls live data from one or more projects and presents it as a chart, list, table, or metric. Dashboards are what most teams open first thing in the morning to see progress at a glance. They are not the same as boards or project reports, and the difference matters when you decide what belongs where.
Boards show workflow in motion. A Scrum or Kanban board is where a team executes daily work. Stories move from To Do to In Progress to Done. Boards are workflow-centric and update in real time as work progresses.
Project reports show historical analysis. Reports like the Burndown or Velocity chart live inside a single project and produce a snapshot of past sprint or release performance. Once generated, the data is fixed.
Jira dashboards show live status across projects. Gadgets refresh automatically at a set interval, and you can combine data from multiple projects on one screen. That is why they work well for cross-team status views, manager check-ins, and release-readiness checks.
For the official reference, Atlassian’s guide to working with dashboards in Jira Cloud documents the current UI and permissions model.
Native Jira dashboard gadgets and what each one shows
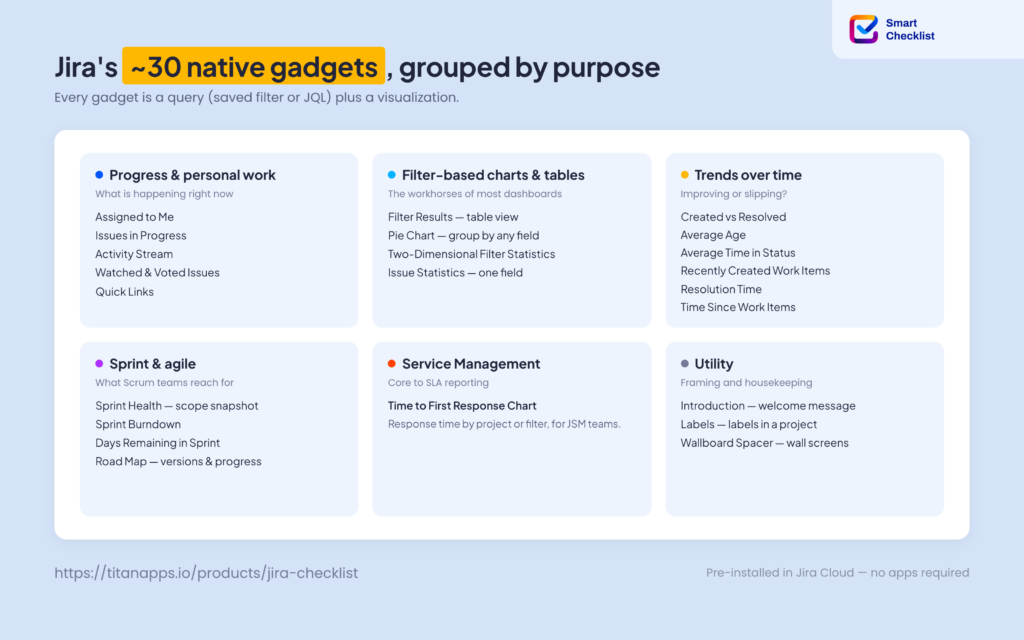
A gadget is a query plus a visualization. You pick or write the query, either as a saved filter or as JQL, and the gadget renders the results as a chart, table, list, or metric. Jira ships with roughly 30 pre-installed gadgets covering the most common reporting needs. This section groups them by purpose so you can find the right one for the story you want to tell.
Progress and personal work
These gadgets show what is happening now, either for you personally or for the team.
- Assigned to Me Gadget lists every open work item assigned to the person viewing the dashboard.
- Issues in Progress Gadget filters that list down to items currently being worked on.
- Activity Stream Gadget shows recent activity across spaces you follow.
- Watched Issues and Voted Issues Gadgets list items the viewer has flagged.
- Quick Links Gadget provides shortcuts to work items linked to the current user.
Filter-based charts and tables
These gadgets take any saved Jira filter and turn it into a visual. They are the workhorses of most dashboards.
- Filter Results Gadget renders a filter as a table of work items.
- Pie Chart Gadget groups filter results by any field, such as status, priority, or assignee.
- Two-Dimensional Filter Statistics Gadget displays a cross-tabulation, for example status by assignee.
- Issue Statistics Gadget breaks a filter down by a single field.
Trends over time
Time-based gadgets show whether things are improving or slipping.
- Created vs Resolved Gadget plots how many work items are opened versus closed over a chosen period.
- Average Age Gadget charts how long unresolved items have been open.
- Average Time in Status Gadget shows the average days work items spend in each status.
- Recently Created Work Items Gadget tracks the rate of new work.
- Resolution Time Gadget shows how long resolved items took to close.
- Time Since Work Items Gadget counts items by a date field, such as Created, Updated, Due, or Resolved.
Sprint and agile
These are the gadgets Scrum teams reach for most often.
- Sprint Health Gadget shows a visual snapshot of scope, work completed, and remaining effort for the active sprint.
- Sprint Burndown Gadget plots remaining work against the ideal burndown line.
- Days Remaining in Sprint Gadget displays a simple countdown.
- Road Map Gadget shows upcoming versions and progress toward their completion.
Service Management
For teams using Jira Service Management, one gadget stands out.
- Time to First Response Chart shows how long agents took to respond to requests for a project or filter, which is core to SLA reporting.
Utility
- Introduction Gadget displays a configurable welcome or announcement message.
- Labels Gadget lists labels used in a project.
- Wallboard Spacer Gadget adds visual spacing when a dashboard is displayed on a wall screen.
For the full list with descriptions, see Atlassian’s dashboard gadgets reference.
Two practical notes before you start adding gadgets.
Most filter-based gadgets need a saved filter to work. If you plan to build several dashboards from similar queries, save the filters first and reuse them. One filter update then reflects on every gadget that references it.
Not every native gadget is available in every plan. Free Jira Cloud sites have some limitations on shared dashboards and gadgets. If a gadget is missing from your dashboard picker, check your plan level and admin settings first.
How to create a Jira dashboard: step-by-step
Creating a Jira dashboard takes a few minutes. The path is straightforward once you know where the controls sit. This walkthrough covers Jira Cloud. Data Center and Server users follow the same logical steps, just from different menu locations. For the full official reference, see Atlassian’s guide to creating and editing dashboards.
Step 1: Open Dashboards and create a new one
From the main Jira navigation, select Dashboards in the sidebar, then View all dashboards. Click Create dashboard in the top right.
If you use Jira often, star the dashboards you visit most. Starred dashboards appear at the top of your list and load faster from the sidebar shortcut.
Step 2: Name it and set permissions
Give the dashboard a clear, descriptive name. Sprint Retro Q3, JSM Weekly Health, and Release Readiness beat generic names like My Dashboard or Team View. People find dashboards by search, so the name is the finding aid.
Add a short description explaining what the dashboard covers and who it is for. This is optional, but helpful when someone opens the dashboard for the first time.
Set the permissions before you add gadgets. Options include:
- Private for personal dashboards
- Group for a specific team or department
- My organization for everyone in your Atlassian Cloud organization
- Public for external stakeholders, when the underlying projects also allow public access
Getting permissions right at this stage prevents the most common issue with shared dashboards: viewers seeing empty gadgets because they cannot access the underlying projects. Atlassian documents the full permission model in the manage shared dashboards guide.
Step 3: Add and configure gadgets
Once the dashboard is created, click Add gadget. The picker opens with the full list of installed gadgets, both native and marketplace. See Atlassian’s add and customize gadgets documentation for the current picker UI.
For each gadget, you will configure:
- The source: usually a saved filter, a project, or a direct JQL query
- The display options: chart type, columns, grouping, or breakdown field
- The refresh interval: how often the gadget re-runs its query
Refresh intervals default to 15 minutes for most gadgets, which is fine for standard status views. Set shorter intervals only when you need near-live data, for example during a release day. Very short intervals across many gadgets add load without adding much value.
Configure gadgets one at a time and check the output before adding the next. It is easier to catch a JQL error on a single gadget than to debug a dashboard with ten of them.
Step 4: Set the layout
Click Change layout in the top right to pick a column arrangement. Jira offers one-column, two-column, and three-column layouts, plus a few mixed options.
Two guidelines make layout choices easier.
Wider gadgets like Filter Results tables and Two-Dimensional Filter Statistics need more horizontal space. Put them in wider columns or single-column rows.
Compact gadgets like Days Remaining in Sprint or Sprint Health work well in narrower columns. Group them together at the top of the dashboard where people look first.
Drag gadgets between columns to reorder. Save your changes when you are done.
Step 5: Save and share
Save the dashboard. Anyone with the permissions you set can now find it under Dashboards in the sidebar. Share the direct URL in Slack, email, or a Confluence page so people can bookmark it.
For dashboards that need to reach people outside Jira, embed them in a Confluence page. Confluence’s Jira Chart macro pulls specific gadgets into a page, which is useful for leadership reports and executive summaries. Atlassian’s guide to sharing Jira dashboards in Confluence walks through the setup.
If you plan to update the dashboard regularly, note the owner in the description. Dashboards without a clear owner tend to drift out of date, then get ignored.
Jira dashboard examples for different team roles
The same set of gadgets can serve very different audiences. A dashboard built for an engineering manager looks nothing like one built for a service desk lead. This section walks through four practical Jira dashboard examples, each built around a specific role and the questions that role needs answered fast.
Use these as starting points, not fixed templates. The gadgets and JQL queries are the vocabulary. The story is yours.
Engineering manager dashboard
An engineering manager needs to see whether the team is on track for the sprint and where quality risks are surfacing. The dashboard should answer three questions at a glance: How is the current sprint tracking? Where are bugs stacking up? Who is overloaded?
A working setup:
- Sprint Health Gadget for the active sprint, filtered to the team’s board
- Created vs Resolved Gadget covering the last four weeks, to spot a widening bug backlog early
- Filter Results Gadget with a query like project = “TEAM” AND type = Bug AND priority in (Highest, High) AND status != Done
- Two-Dimensional Filter Statistics Gadget showing status by assignee, to catch workload imbalance
The four gadgets together tell a story about pace, quality, and load. If engineers regularly interpret their own progress differently, Jira productivity metrics covers how to pick a small set of numbers everyone agrees to review.
Delivery manager dashboard
A delivery manager cares less about day-to-day activity and more about whether commitments will land. The right dashboard focuses on scope, timeline, and risk.
A working setup:
- Days Remaining in Sprint Gadget for a countdown teams actually notice
- Road Map Gadget showing upcoming versions and completion progress
- Two-Dimensional Filter Statistics Gadget with issue type on one axis and status on the other, filtered to the active release
- Filter Results Gadget for scope-change risk, using project = “REL” AND (labels = “added-mid-sprint” OR created > startOfSprint())
The Road Map gadget is the anchor. Everything else sits around it as context. When teams need to look back at what a previous sprint actually delivered versus committed, how to view previous sprint in Jira covers the mechanics.
JSM service desk dashboard
For a service desk lead running Jira Service Management, the dashboard is about SLA compliance and workload distribution across agents.
A working setup:
- Time to First Response Chart for the main service project, showing average response times over the last two weeks
- Pie Chart Gadget grouped by request type, to see whether one category is dominating the queue
- Filter Results Gadget for SLA breach risk: project = “HELP” AND “Time to first response” = breached() OR “Time to resolution” = breached()
- Two-Dimensional Filter Statistics Gadget showing agent by status, to balance load across the team
The SLA breach filter is the one to check daily. Everything else is trend context. For teams running JSM specifically, the Jira Service Management guide covers the fields and workflows behind these gadgets.
Release readiness dashboard
This is the dashboard native gadgets alone struggle with. Release readiness is not about whether tickets are in the Done column. It is about whether every required step on every ticket is actually complete. Definition of Done items, QA sign-offs, security reviews, documentation updates – the work that has to happen before Done means Done.
A working setup:
- Sprint Health Gadget for the release sprint, as the top-level pulse
- Filter Results Gadget with fixVersion = “2.4.0” AND status = “Ready for Release”, to see the release scope
- Smart Checklist Completion Gadget filtered by the same fixVersion, to see how much of the checklist work across those stories is actually done
- Filter Results Gadget for open checklist items with fixVersion = “2.4.0” AND “Smart Checklist Progress” ~ “-Done”, to catch stories that reached Ready for Release with unfinished checklists
The last query is the one that surfaces stories nobody thought to check. A story can be In Review, all fields green, and still have three open items in its checklist. The Smart Checklist gadgets and JQL together make that visible before the release meeting, not during it.
The next section covers those gadgets in more detail. If your team uses checklists to enforce a definition of done in Jira, this is where a dashboard starts earning its keep.
How to track checklist progress on Jira dashboards
Native gadgets show that a story reached the Done status. They cannot show whether the checklist inside that story was completed. For that you need dashboard gadgets that read checklist data directly.
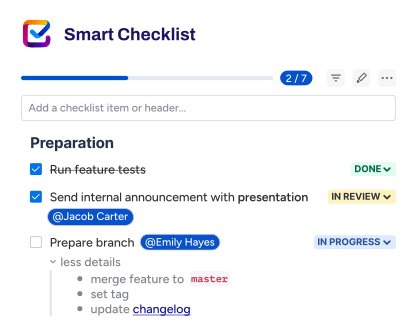
Smart Checklist takes a different approach because checklist items are not work items. They are indexed content on the parent work item. That means progress shows up in several places at once.
On the agile board, each work item card can display its checklist completion, for example 7/10, so team leads can see progress without opening tickets. The Checklists field and the Smart Checklist Progress field are both queryable in JQL, which means any Filter Results gadget on a Jira dashboard can slice by checklist state. That single fact is what makes checklist-based reporting possible without exporting to a spreadsheet or building a custom report.
Smart Checklist also ships dedicated dashboard gadgets so you can build a real reporting view without leaving Jira.
Completion Gadget
The Completion Gadget shows the checklist completion rate across a filtered set of work items. A Scrum Master can spot bottlenecks at a glance without opening every ticket. Point it at a sprint filter, a release filter, or a whole project, and it returns the aggregate completion rate plus a breakdown of Done, In Progress, To Do, and any default statuses in use.
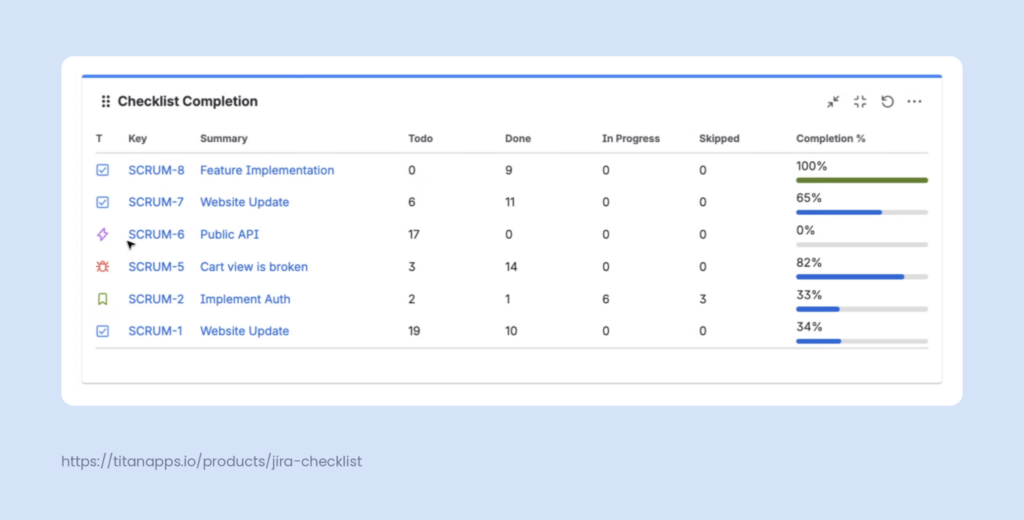
Combined with a saved JQL filter, the Completion Gadget answers questions like: How much of the checklist work in the current sprint is actually done? Which epic still has open items across its child issues? Are we ready for the release meeting, or does half the release scope still have open items?
Assigned to Me Gadget
The Assigned to Me Gadget lists checklist items assigned to the current or any other user across every work item. Team members have a single place to see what is on their plate, without having to open each ticket to find the items assigned to them.
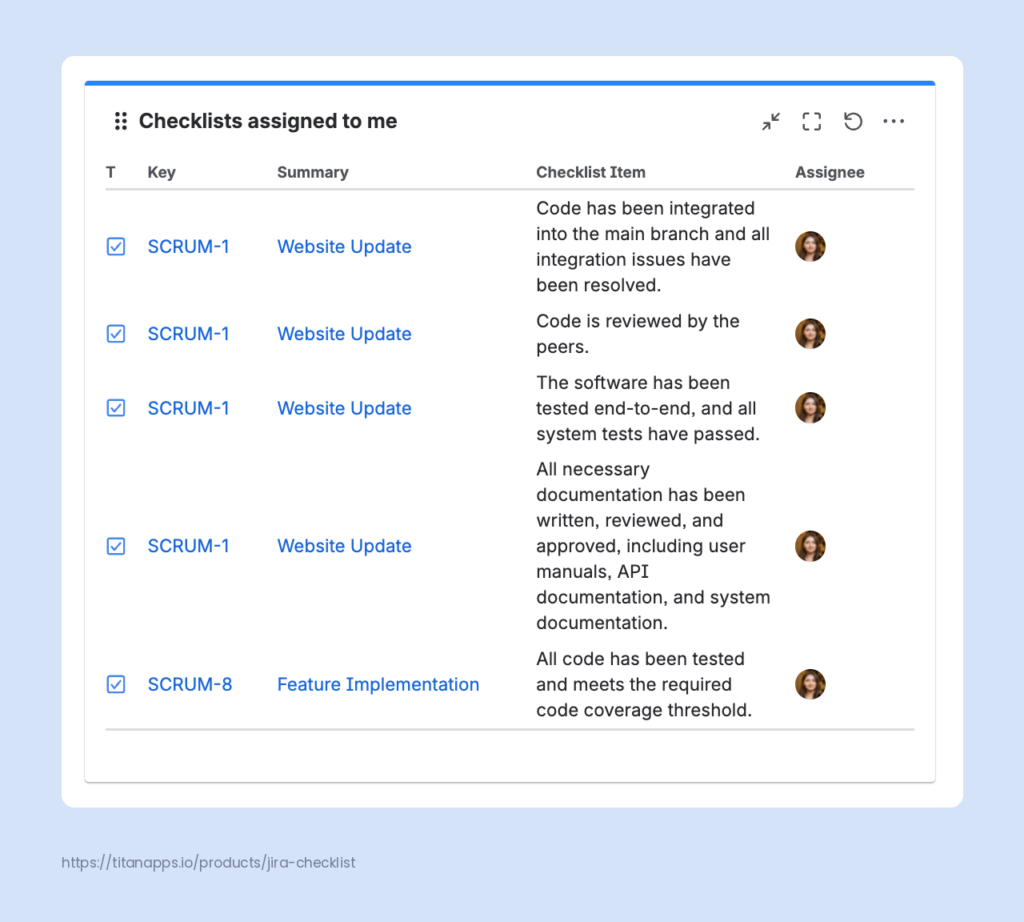
For a QA engineer with test cases assigned across 15 stories, or a technical writer with documentation items scattered across a release, this gadget replaces a spreadsheet. It also shows the parent work item, so the assignee knows the context of each item.
Pie Chart Gadget
The Pie Chart Gadget visualizes checklist item status distribution across a JQL search. Done, In Progress, To Do, and any default statuses appear as segments. It is the fastest way to answer “how much of this is done?” for release-readiness reviews and audit views.
Note: ID custom status means “completed” it will be done. IF custom status means “not completed” – it will be shown under todo. We don’t show custom statuses in our gadgets (at least for today)
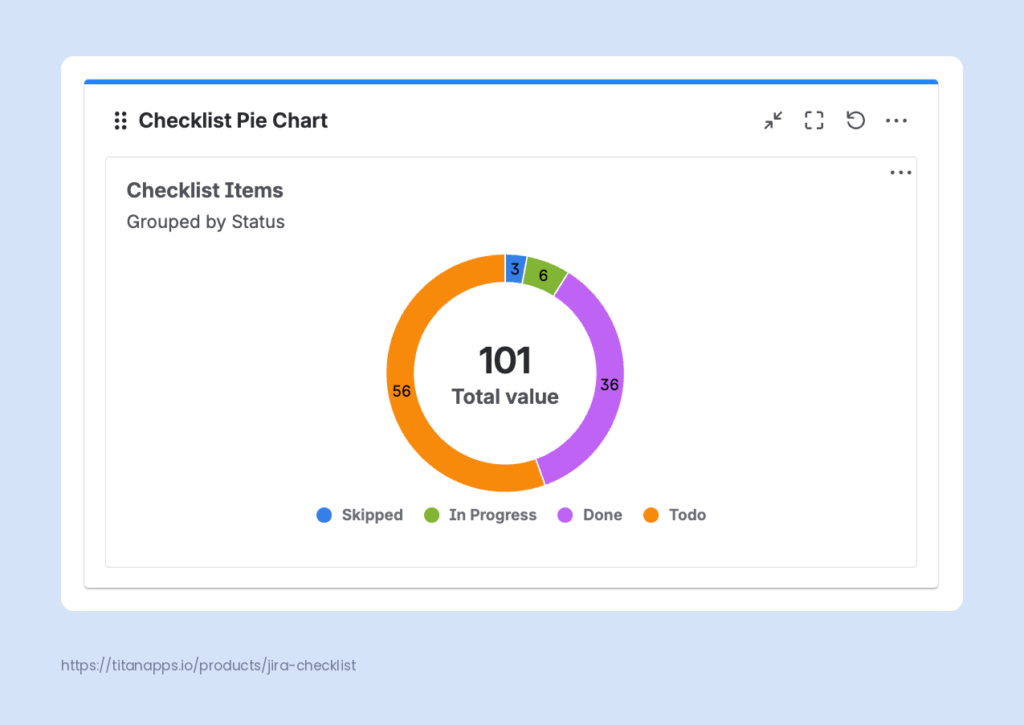
Group by status category, status, or item assignee depending on the story you want to tell. A release manager might group by status. An auditor might group by status category to see whether compliance items are progressing.
Combining the gadgets with JQL
The gadgets share Jira’s standard JQL as their filter language. Anything you can build in Advanced Search can drop into a gadget. That is what turns three specialized gadgets into a full reporting dashboard.
A release readiness dashboard might combine:
- A Completion Gadget filtered by fixVersion, to see aggregate progress
- A Pie Chart Gadget on the same filter, to see the status distribution
- A native Filter Results gadget with fixVersion = “2.4.0” AND “Smart Checklist Progress” ~ “-Done”, to list the specific work items still holding the release
- An Assigned to Me Gadget for each team member who owns items in the release
Together they show the shape of the work, the specific blockers, and who owns them.
Note
Smart Checklist content is queryable with JQL, so you can filter work items by checklist progress, item text, or items assigned to a specific person. For example, “Smart Checklist Progress” ~ “-Done” returns every work item with open checklist items.
See the Smart Checklist JQL Search documentation for more query examples and syntax.
For teams building a formal release readiness checklist, these gadgets are what let the checklist double as a live dashboard. The list is the process. The dashboard is the proof it was followed.
Smart Checklist is available on the Atlassian Marketplace for both Cloud and Data Center. The dashboard gadgets are included in the Pro plan in Cloud only.
Sharing depends on two layers: the dashboard permission and the underlying project permissions. If viewers cannot access the projects the gadgets pull from, they see empty gadgets even after you share the dashboard. Set both correctly before sending links.
The main sharing options in Jira Cloud:
- Private for personal dashboards
- Group for a specific team or department
- My organization for everyone in your Atlassian Cloud organization
- Public for external stakeholders, when the underlying projects also allow public access
Data Center and Server also offer the Any logged-in user option, which shares with anyone who can sign in to the instance.
To share, open the dashboard, click the share icon in the header, pick the audience, and save. For external distribution, embed the dashboard in a Confluence page using the Jira Chart macro. Atlassian documents the full permission model in the manage shared dashboards guide.
Jira dashboard best practices
A few rules keep dashboards useful over time.
- Cap each dashboard at six gadgets. Anything more competes for attention and the story gets lost. If you need more, build a second dashboard for a specific use case.
- Match one dashboard to one audience and one question. A dashboard that tries to serve everyone serves no one.
- Name dashboards descriptively. Release Readiness Q4 and JSM Weekly Health beat Team Dashboard. People find dashboards by search, so the name is the finding aid.
- Use saved filters instead of hardcoded JQL inside each gadget. One filter update then reflects everywhere it is referenced.
- Assign an owner. Dashboards without a clear owner drift out of date and get ignored. Note the owner in the description.
- For process compliance dashboards, pair a Smart Checklist gadget with a native status gadget. The two together tell you whether work is moving and whether it is ready.
Conclusion
A Jira dashboard earns its place when it answers a specific question fast. Sprint Health tells you whether the team will land the sprint. Time to First Response tells you whether the service desk is meeting its SLA. A Smart Checklist Completion Gadget tells you whether the release is actually ready to ship, not just whether the tickets moved to Done.
Native Jira ships enough gadgets to cover most reporting needs. The gap starts to show when you need to track process compliance – the checklist inside the ticket, not just the ticket status. That is where dedicated marketplace gadgets close the loop.
If your team needs a dashboard that tells you whether work is truly done, Smart Checklist on the Atlassian Marketplace adds the missing view.
Frequently asked questions on jira dashboard
How do I create a Jira dashboard as a beginner?
Open Dashboards in the left sidebar, click View all dashboards, then Create dashboard. Give it a name, set the sharing permissions, and save. From the new dashboard, click Add gadget to pick from the list of installed gadgets. Start with two or three gadgets rather than filling the page. Sprint Health, Assigned to Me, and a Filter Results gadget for your team’s project are a solid starting point that you can expand once you know what questions the dashboard needs to answer.
Yes, but with limits. The Public sharing option makes a dashboard visible to anyone on the internet, though viewers can only see the underlying work items if those projects also allow public access. For controlled external sharing, embed the dashboard in a Confluence page and share the Confluence page instead. This works well for leadership reports and customer-facing summaries where you want to control the exact view.
What is the difference between Jira boards, reports, and dashboards?
Boards show workflow in motion. Reports show historical snapshots of a single project. Dashboards show live status across one or more projects, refreshed automatically. Teams executing daily work use boards. Retrospectives and audits use reports. Managers, delivery leads, and stakeholders use dashboards for cross-project visibility.
Can I track checklist progress on a Jira dashboard?
Yes. Native Jira does not report on checklist content, but Smart Checklist adds three dedicated gadgets: the Completion Gadget for aggregate completion rates, the Assigned to Me Gadget for personal checklist items, and the Pie Chart Gadget for status distribution. Because the Checklists field and Smart Checklist Progress field are queryable in JQL, native Filter Results gadgets can also slice by checklist state. This makes release readiness and compliance dashboards possible without leaving Jira.
Because the viewer does not have permission to see the underlying projects or filters. Dashboard sharing and project permissions are separate layers. Give the viewer access to the projects the gadgets query, and re-check that any saved filters used by the gadgets are shared with the same audience. This is the most common issue with shared dashboards and it takes minutes to fix once you know where to look.